Force Plate Dashboard Overview
A short video walkthrough of force Plate Dashboard Overview from the TeamBuildr knowledge base.
Watch or read
6 minutes across 4 chapters. Click any chapter or timestamp to jump straight there.
4 chapters
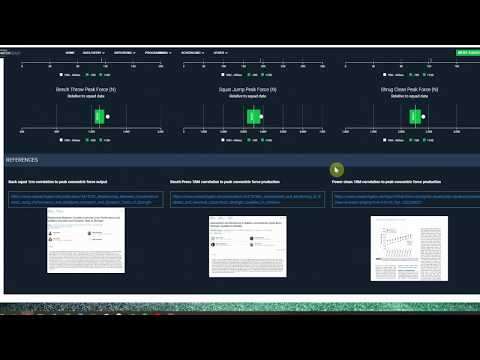
As of January 2025, the Forceplate dashboard now has the ability to create templated views to allow for quicker reporting lines. To create a new dashboard, click the plus button. You'll be prompted to select two metrics to populate on the bar and line chart that is shown in the dashboard. Select the drop-down bar here and select two metrics that you'd to show on that chart. You'll now have the opportunity to select your own custom KPIs to populate the five bottom cards below the bar and line chart. If you leave it selected at default, it will be the default five that previously populated before this update. If you select custom, it will open up this area below to select and deselect different metrics. You can do so by clicking the checkbox or the X's to the.
Right in the selected metrics area. Select five that you'd to view on those cards. Once you've selected five, you'll notice the ability and inability to select more metrics. And if you'd to swap any out, again, just use that system of selection or deselection. Once you have this set to the configuration that you hit load dashboard. You'll need to select a group. You'll also need to select a date and time in which they should have forest plate information. Since this is the demo account, I will select a time frame in which we have information populated.
Still stuck? Contact support →
Read next
More in AMS
Walkthrough
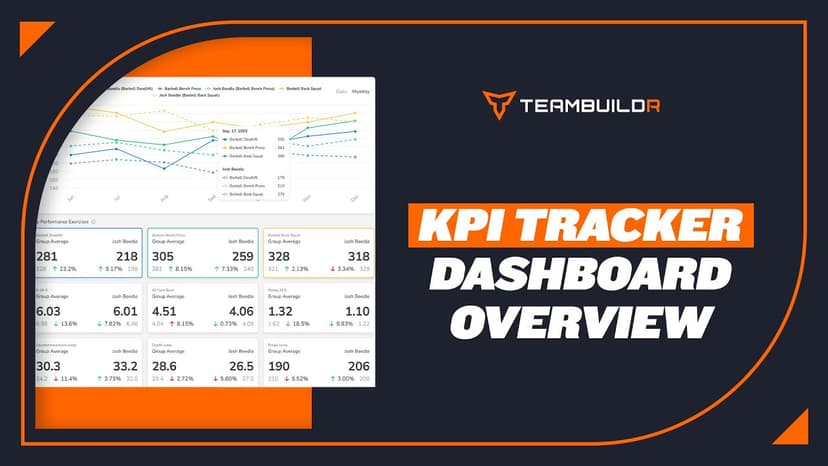
FreeKPI Tracker Dashboard Overview
A short video walkthrough of kPI Tracker Dashboard Overview from the TeamBuildr knowledge base.
Also in Testing & Monitoring
Walkthrough
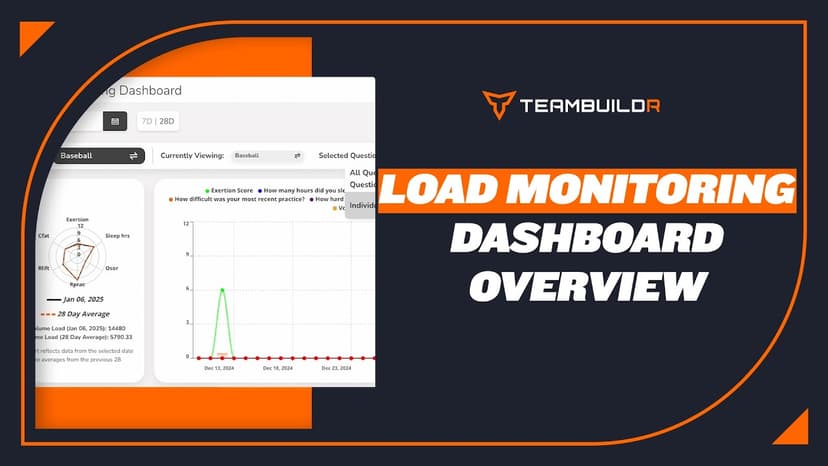
FreeLoad Monitoring Dashboard Module
The Load Monitoring Dashboard is a module that only comes with our AMS LITE add-on. The only module that is free within AMS LITE is the Wearables Dashboard module.
Also in Technology & Integrations
Walkthrough
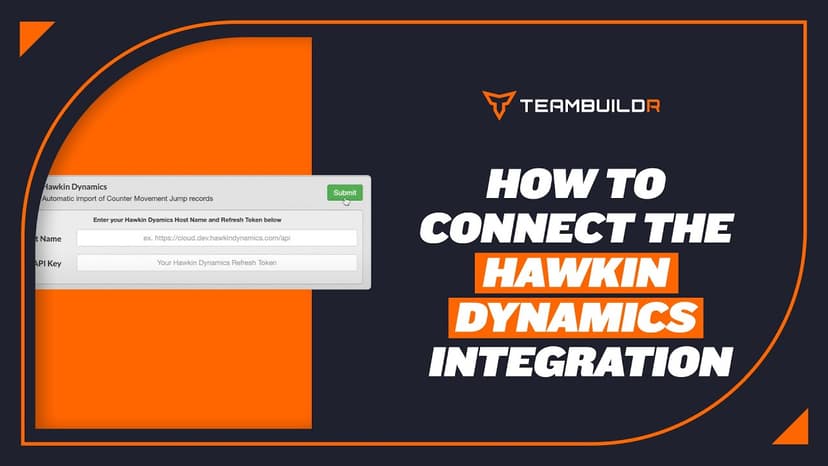
FreeConnecting Hawkin Dynamics Force Plates to TeamBuildr
Link Hawkin Dynamics plates so jump data arrives in an athlete's workout without anyone exporting a file. Setup needs a hostname and an API key, and matching names on both sides. What you can see afterwards depends on your plan.
4 chapters · 5 lessons
Free · sign upA Beginner's Guide to Navigating Force Plate Technology
Learn the best ways to approach force plate technology and practical ways to use it.

Read on the blog · 3 min
FreeForce Plate Technology: Benefits & Considerationsopens blog.teambuildr.com in a new tab
Force plates provide data on movement mechanics, helping coaches assess performance, adjust training loads, and optimize athletic development.
Also in Platform & Admin
Video · 2 min
FreeSmartabase S&C dashboard integrating data from TeamBuildr & GymAware.
Smartabase S&C dashboard integrating data from TeamBuildr & GymAware. — from the TeamBuildr YouTube channel.
- Format
- Walkthrough
- Brand
- TeamBuildr AMS
- Category
- AMS